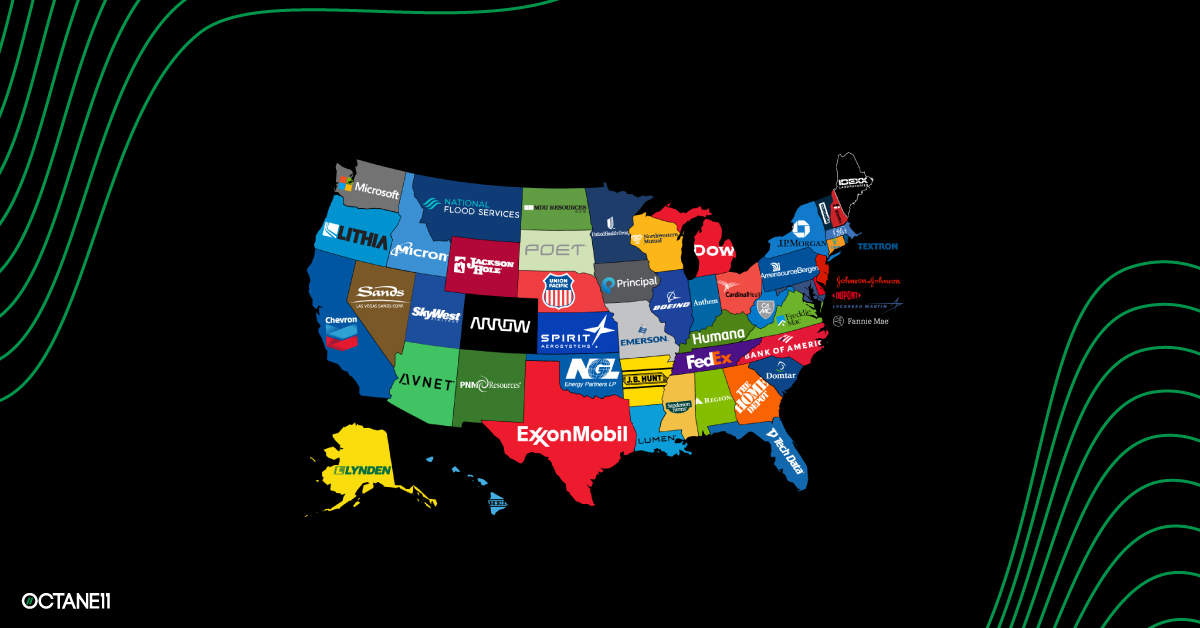
This week we’re taking a look at the largest B2B marketers in the U.S. by state to see what we can learn from their tech and tools. Hat tip to Steve Lovelace for his 2012 map showing the largest company in every state and similar infographics from Business Insider and visualcapitalist.com. What’s new in this graphic is not only applying the B2B-only lens, but also using this as a framework to dig into the martech tools deployed by these companies (using publicly available data via the Ghostery web browser plugin). As a B2B-focused analytics and collaboration business that officially launched earlier this year, analyzing this data has been helpful for understanding technology trends and needs in the market. Here’s what we learned:
Top 10 lessons learned by analyzing the largest B2B enterprises in every US State:
1) B2B as a category is extremely diversified. B2B is often listed among “industry verticals” but the truth is that B2B spans almost every industry — and this chart makes that as plain as day. Financial services, transportation, energy, insurance, aerospace, telecom, manufacturing, and more – it’s all covered in B2B, which makes it even more challenging for B2B sales and marketing teams to find solutions that suit their specific needs.
2) Some B2B’s are household names, but most are not. Some brands span both B2C and B2B, and as such are more recognizable to the average person (JP Morgan, ExxonMobile, FedEx, etc), but there are many that are either known only within their region or only in a narrow field. This presents a great opportunity to leverage digital marketing to create awareness, drive consideration and deliver sales among broader customer bases and regions.
3) In a previous post on the Rube Golberg-esque state of B2B marketing, I noted how fragmented technology stacks are for B2B sales and marketing teams – and the data from this analysis proves the point. The average number of activity tracking technologies (aka tags or pixels) employed by these companies is 13.5 per site, with some deploying as many as 34. That’s pretty high considering that some of the top consumer ecommerce sites like Walmart, Target and BestBuy, which you might expect to be using more behavioral tracking tools, use an average of only 10 tracking tools. (Tracking tags are not an exact window into all of the tech in use, but it’s a good directional proxy). (By the way, there are two sites with exactly zero tags!)
4) The top 10 most widely used activity tracking technologies across these companies (with the % of sites where they are present) are:
- Google (82%)
- Facebook (58%)
- Drawbridge (44%)
- LinkedIn (44%)
- Adobe Omniture (32%)
- Twitter (32%)
- Bing (18%)
- LiveRamp (18%)
- New Relic (18%)
- Trade Desk (16%)
That’s a pretty good mix across analytics and advertising targeting. No surprise about Google being top of the list (that stat includes Google Analytics, Google TagManager, DoubleClick Ads, AdWords and several others). Interesting to see Drawbridge (cross-channel tracking) and New Relic (website performance) in the top 10. Looking ahead, I would expect LinkedIn to have some headroom to rise up the rankings. Although site and tech stack changes can be slow moving, it will be interesting to revisit this chart in the coming year.
5) The top email platforms, one of the core B2B marketing tools, on the list (with the % of sites where they are present) are:
- Eloqua 8%
- Marketo 8%
- Hubspot 4%
- Pardot 2%
This mix pretty much matches what I’ve been seeing as I’ve talked with B2B marketers, so no surprises there. What is surprising though is how low the percentages are in terms of sites where their tags are present on the home page. Presumably these companies are including these trackers on their form pages and landing pages, but why not include them on your home pages as well – particularly if you are using your email platform to capture tracking consent?
6) Across all these 51 major B2B companies, only 9 have a chatbot deployed on their main site. We love chatbots for lowering the bar on client and prospect engagement, so this is surprising to see. At worst, chatbots are simply an interactive “contact us” form – but at best they can accelerate leads and take a huge burden off of your call center and your front-line sales personnel. Chatbots have been around for years, but they seem to be gaining momentum through easier setup tools, AI-driven conversational tools, better integrations with the rest of the martech stack – and the overwhelming drive to real-time commerce.
7) Just about half of these top companies (26) have a pure play DMP or CDP in place, with Adobe Audience Manager having the most share (15) and Neustar/Aggregate Knowledge, [m]Platform, Oracle/BlueKai and Krux, rounding out the rest. This is pretty surprising given how critical data management is for driving value from your cross-channel B2B marketing. For B2B marketers that are struggling to drive value from cross-channel activities, deploying a CDP or using a multi-channel analytics and collaboration tool like Octane11, could create huge ROI.
8) The total number of distinct tags across all of these sites is a whopping 121. Some vendors have several different tags (eg. Google alone had 9 different tags, by far the most of any vendor), but the huge number of tags and vendors shows just how dynamic the martech category continues to be. What new tools and tags will emerge in the coming year?
9) Myspace Lives! One site in the group (not to be singled out by name), still has an active myspace tracker! I wonder if they are actively using it for tracking with myspace under new ownership, or maybe it’s just a reminder to the rest of us that you should check your website tags at least once a year to clean out any dormant tools.
10) Several states are ripe for new top players. As noted in Business Insider’s US map infographic last year showing the biggest Fortune 1000 companies in every state, there were 7 states — Alaska, Montana, New Mexico, South Dakota, Vermont, West Virginia, and Wyoming – that did not have a company on the list. We also found it difficult to identify top B2B companies in many states – though we did find them! That said, given some recent corporate moves – Oracle, HPE, Palantir, Tesla – announcing HQ moves out of California, perhaps accelerated by the global pandemic and the move to remote work, even this B2B map could look quite different in the coming years.
Infographics, tools and data analytics – all some of my favorite things. What other insights can you observe from this data? What other questions do you have? Feel free to direct message me with comments or ideas for further analysis – and if you’re wrestling with your own B2B martech stack, talk with our chatbot about how we might be able to help.


